Aura Gas CRM

Aura Gas CRM

LaravelVue.Js
This project involved adding a wide array of features to a customer relations management web application to allow a Gas company to manage customers, sales, inbound emails and finance. Building this application required extending Laravel backpack with Operations and custom UI components

Extending Laravel Backpack

Extending Laravel Backpack

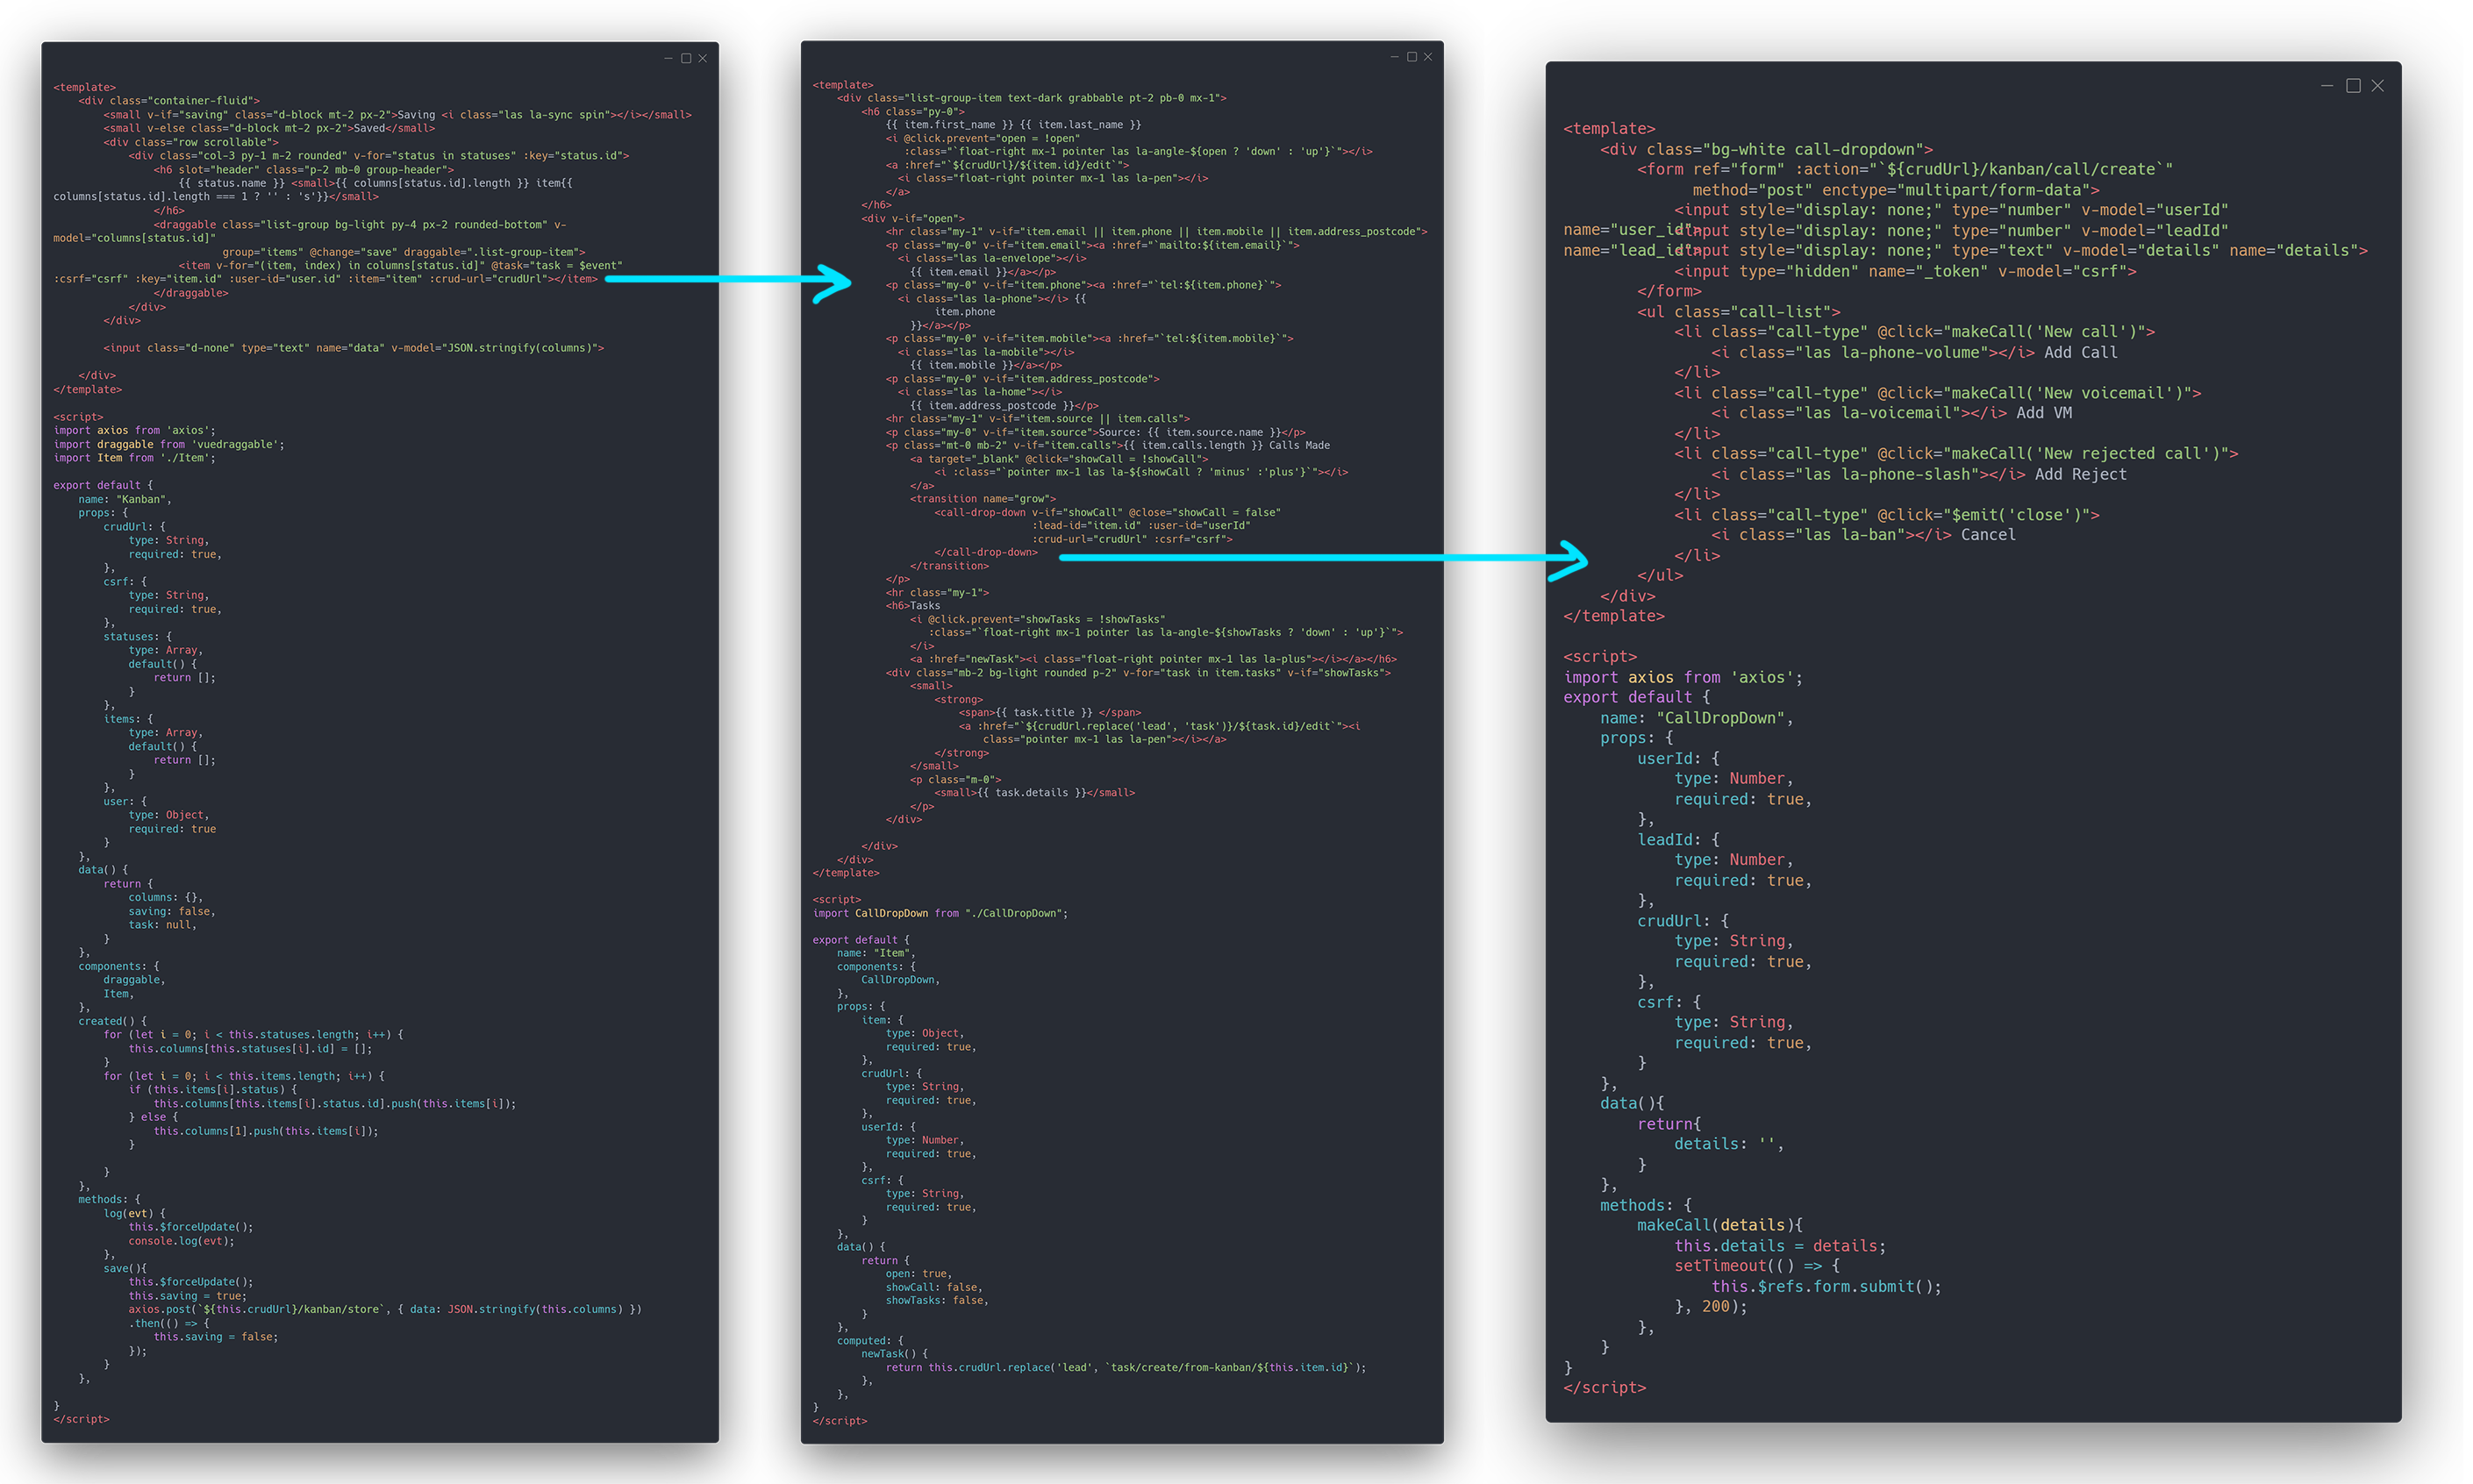
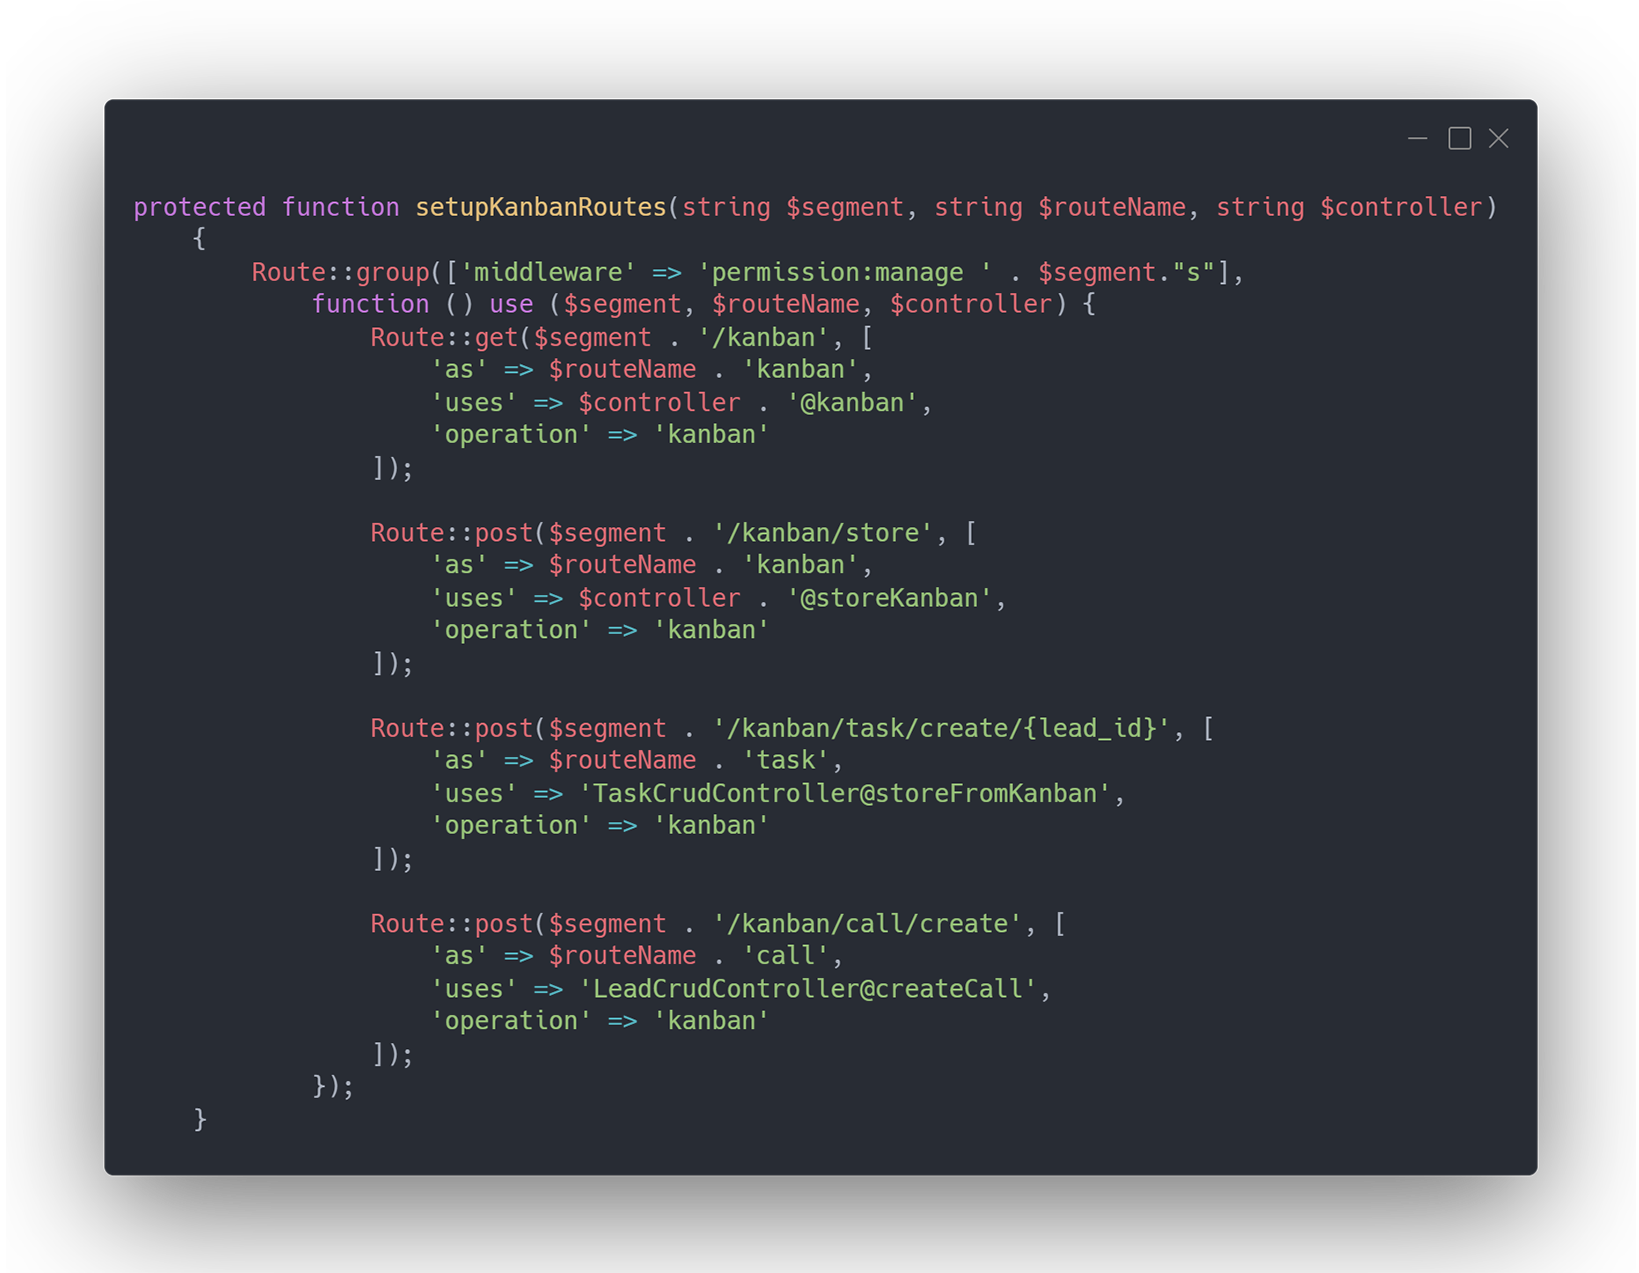
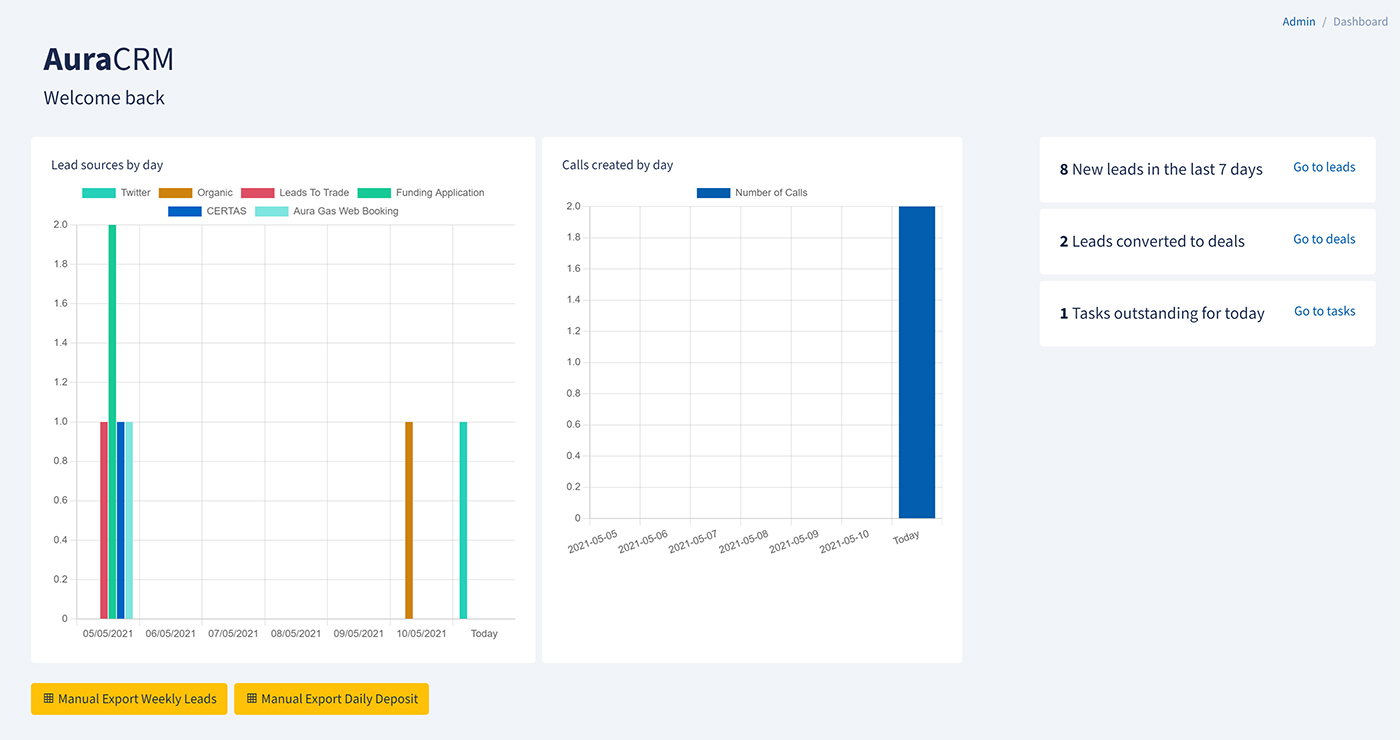
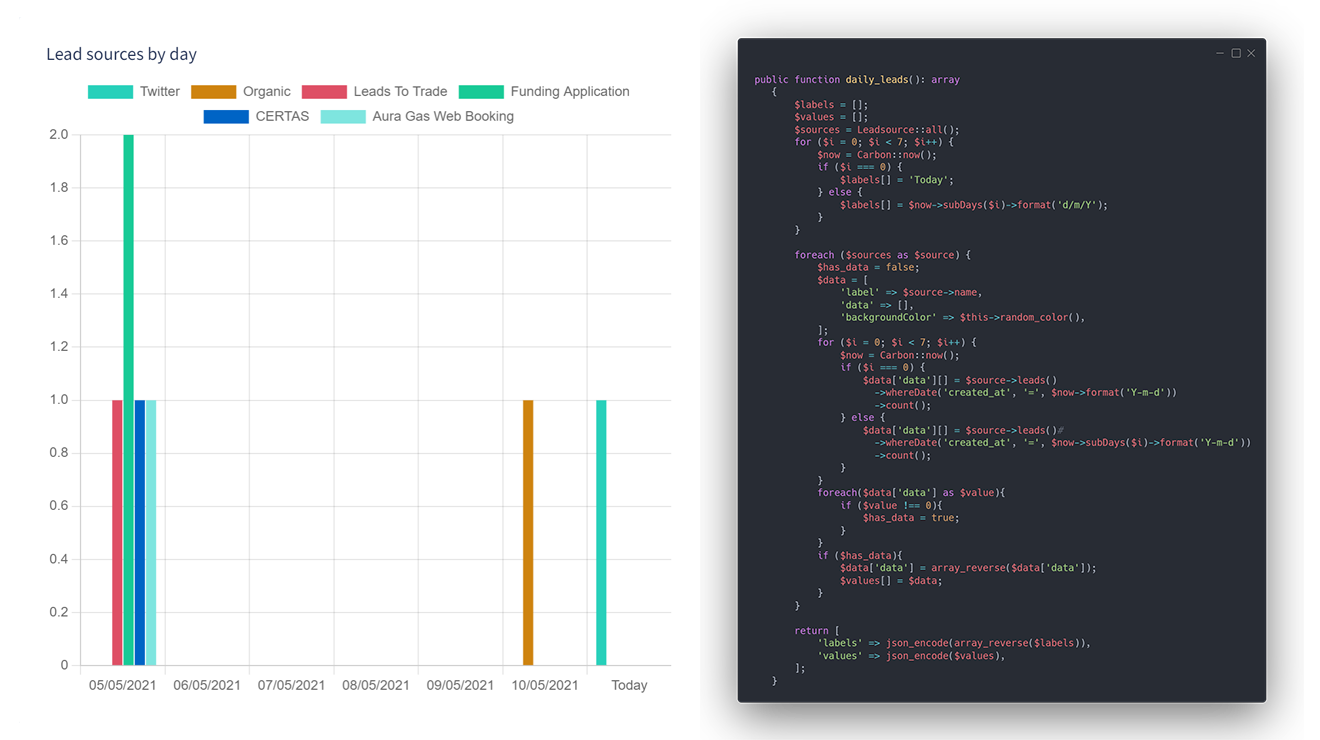
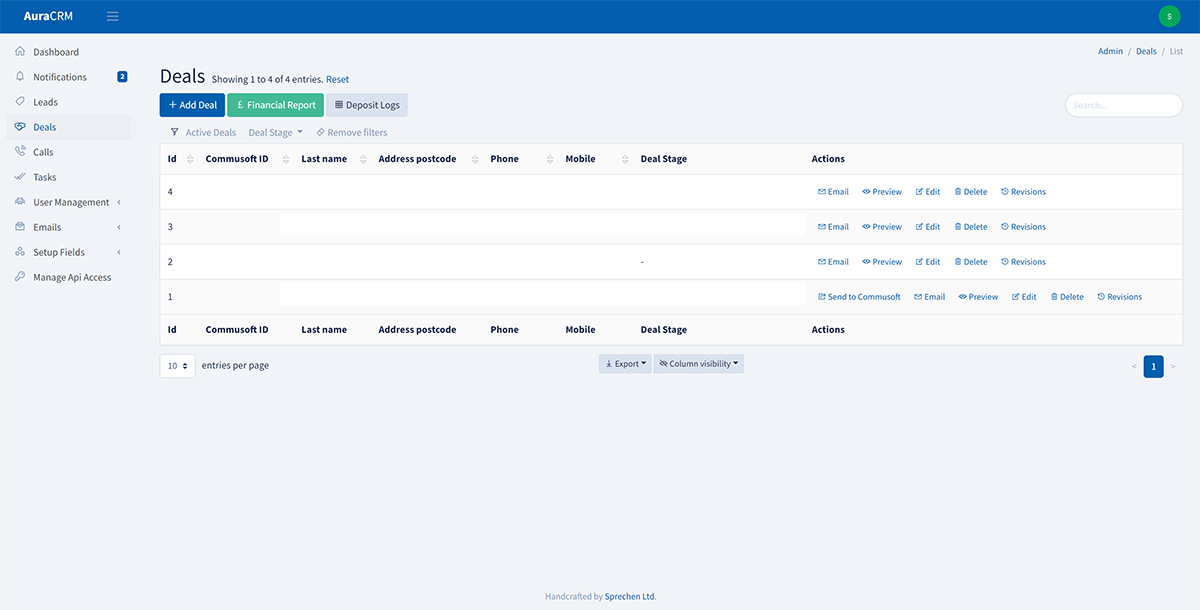
This project is built with Laravel backpack as the foundation so that we could focus on building custom functionality specific to the client rather than spending loads of time building out simple CRUD admin. Backpack provides a fantastic API for building custom buttons, views and fields we could use to manipulate data and carry out tasks.
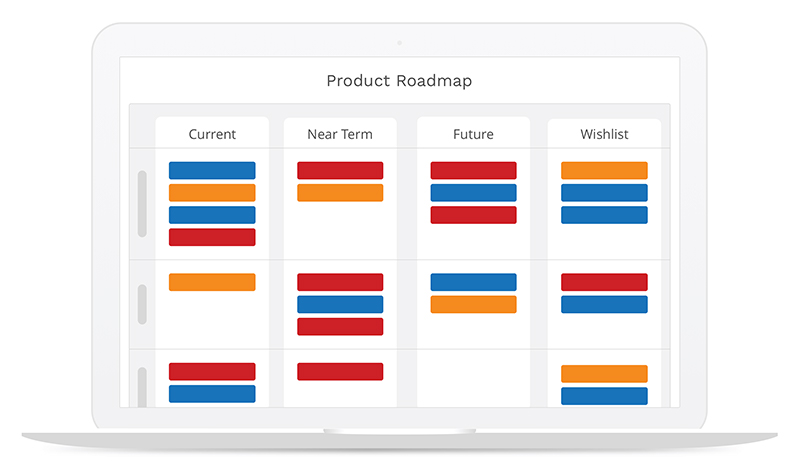
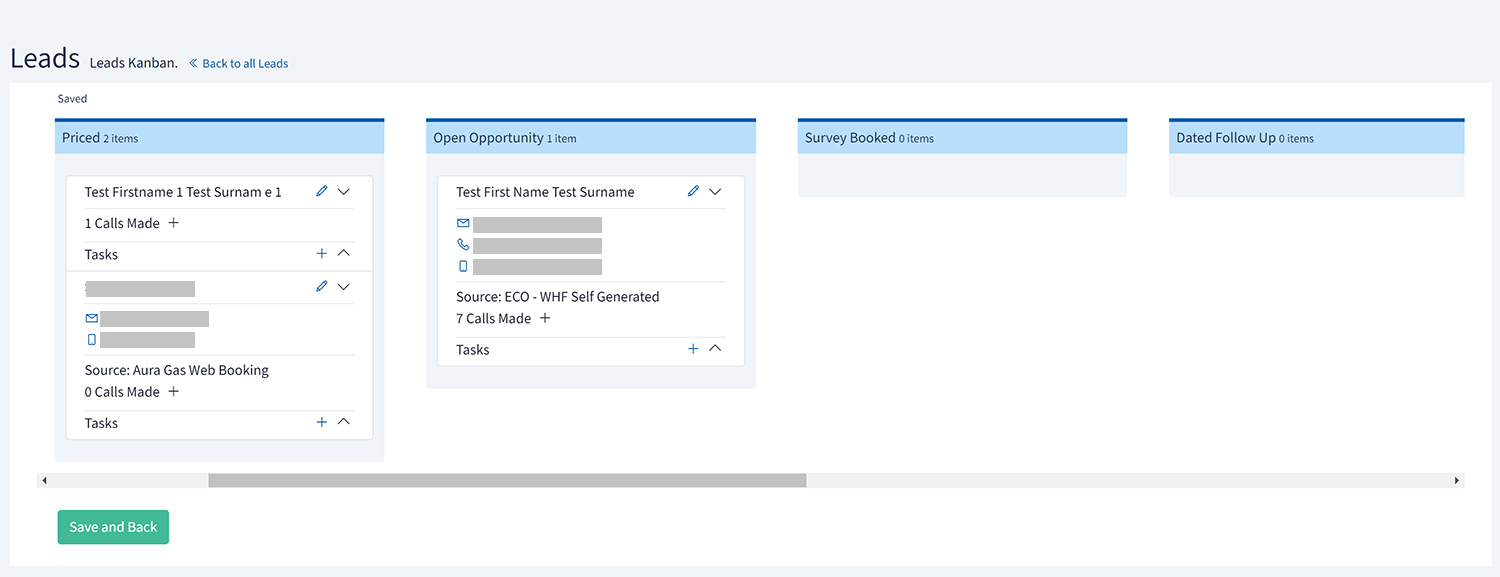
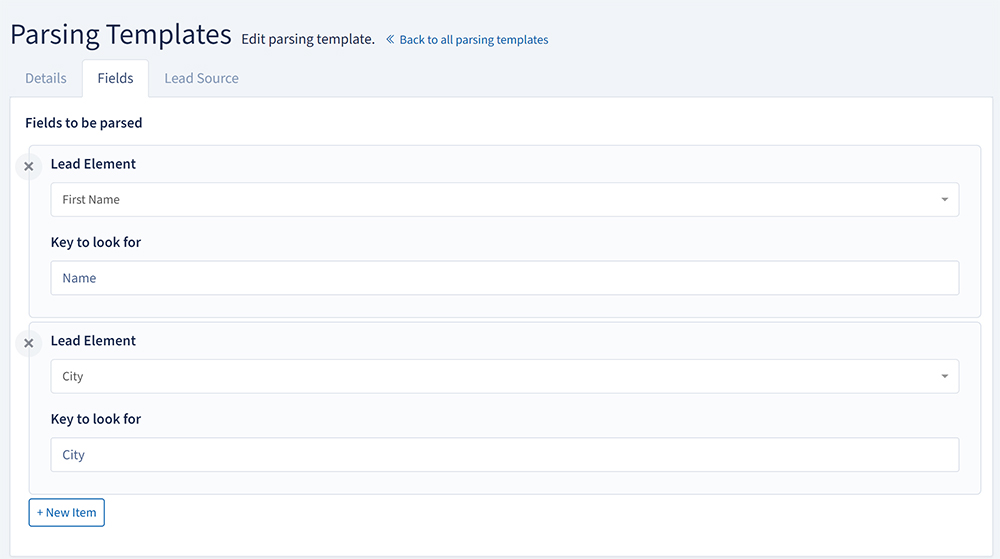
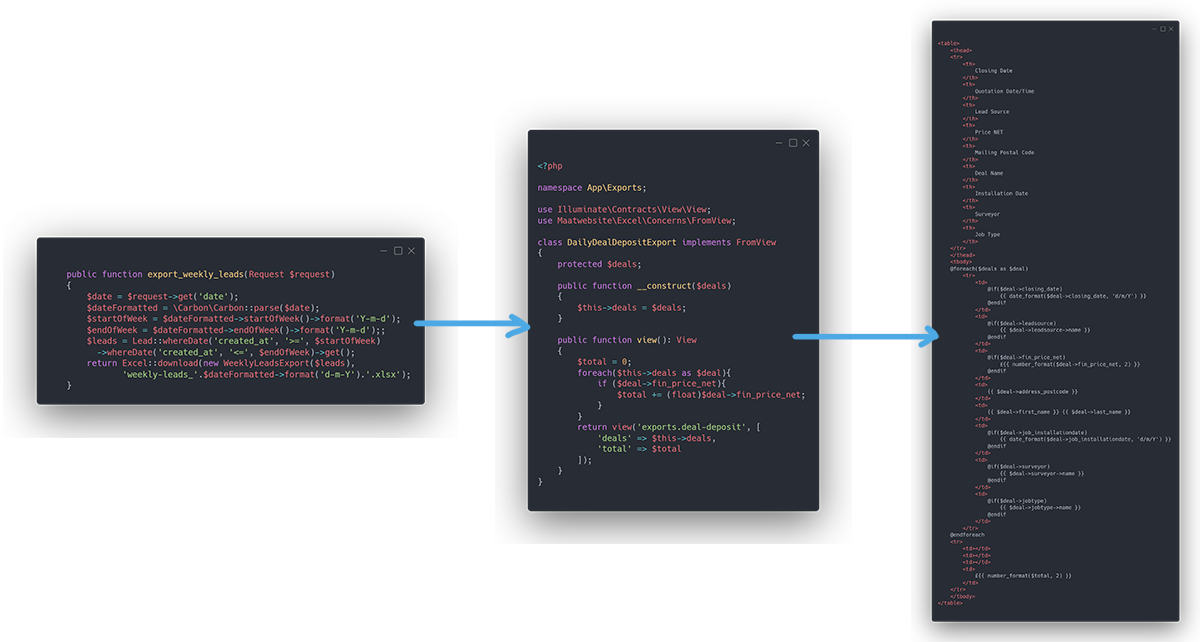
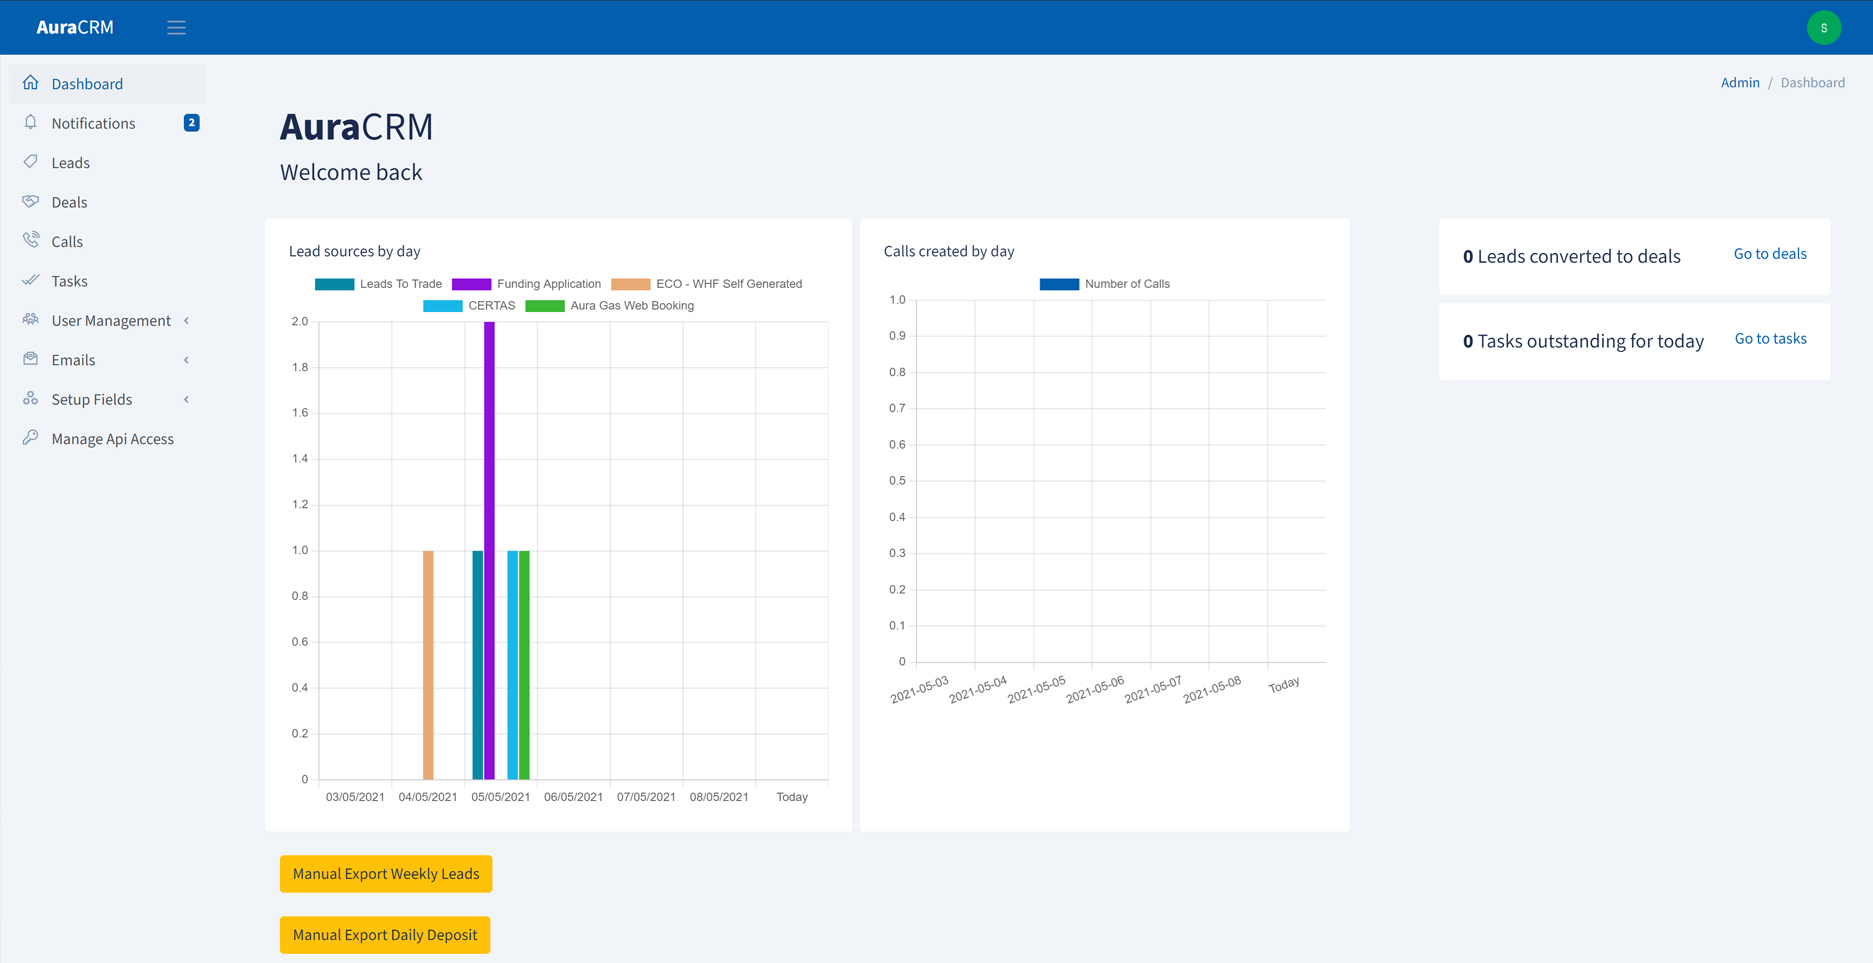
Building a Kanban board

Building a Kanban board

Kanban boards are a popular way of managing tasks in software with a visual user interface where a user can drag elements around. Aura Gas wanted this implemented so that they could manage their inbound calls between different statuses as well as add tasks and notes to them. This would make it easy for their customer relations team to manage their daily enquiries and offer a quick way to update what they've done.

How it would work

The Kanban board I would build works like this diagram. The Kanban component would hold an array of statuses which act as each card on the board. Each Kanban holds an array of tasks which can be taken from and added to each array to move cards across from board to board. This method would then make for an easy way to assign the status id to the task when being saved to the database.

Kanban Code

Kanban Code

Below is the code for the Kanban Vue components. From left to right there is the main Kanban, the Kanban Items and dropdown elements that work together to build the UI.


Kanban Board

This component brings everything together and stores the arrays for the items to move between and handles saving the data to the API route. This component has a computed property that takes the data and turns it into JSON before sending it off to the API.


Item

These components are used to display data and have the draggable attribute to move them between the arrays.


Call Dropdown

These sit within the item tabs and can be used to add calls to a lead with a small form UI. The form offers three different options that can be used to create different categories of form.

Kanban UI

The UI built with Bootstrap is simple, large, and easy to understand. This means that tasks can be performed quickly while on the phone and links are easy to find and go to. The Kanban has auto save functionality built into it so the user does not need to click save and back before leaving the page negating the risk of data loss.

Kanban Operation

Kanban Operation

As the Kanban would eventually be adapted in other projects, I built an operation for the CRUD controller. Operations in backpack are files that provide functions and configuration for data management. For example, backpack comes with create, updated, list and delete by default for basic data manipulation. The Kanban operation starts off when its constructed by building the required routes for the API. These routes use the data about the CRUD value so that it is adaptable to any model.

Kanban Functions

The rest of the functions in the operation provide handling for saving data such as the leads inside the board and calls made from it. For example, the save method decodes the JSON data and assigns each lead the status ID of the array its in. These functions use hard coded values for leads but could be adapted using the CRUD controller's data in order to work with other models.

Parsing Inbound Emails

Parsing Inbound Emails

A requirement for the project was to take content from incoming emails and parse the data for information about a job or sender. This would enable Aura Gas to automate their inbound enquires and have them be sent directly to their customer relations team with the relevant data rather than needing to skim through emails to find the right information. The challenge in this task came from working out what data comes from what part of the template and how to programmatically take it out.

Parser logic

The idea behind the email parser's logic was to split up the data into an array and finding values within the array. To do this, I first split the email at each line break to build a list of all of the lines in the email. Next I could split each item in a smaller list by splitting it at a colon which most of their emails followed the pattern of using. I would then be able to check the first item against the email parser's configuration to check if it is a field we're looking for. If it is, the value to the right will be saved along side it as a new lead attribute.

Configuring email parsers

Configuring email parsers

Obviously it would be incredibly hard to make a one size fits all parser for every type of email without writing masses of code so the best way to approach it was to make different parsing configuration. Each set of data uses an inbound email address and a list of key and value pairs. The inbound email dictates when that parser should be used and the key value pairs define where data should be pulled from and what aspect of the lead it should be assigned to.

Exporting Useful Data

Exporting Useful Data

As with most applications, exporting the data is an incredibly useful feature. In this case, they needed to export weekly lead reports, daily deposit reports and monthly finance reports. To make these, I used Maatwebsite\excel which can be used to build excel sheets from blade views allowing for a visual way to produce the sheets rather than trying to guess and export with standard functions.

Analytics

Analytics

Analytics are always a helpful addition to an admin application as it can show useful data at a glance and give an insight as to what needs to be done. For this application, the client wanted a set of charts to visualise how many inbound enquiries were being converted to deals and outstanding tasks and calls for the day.

Chart.js

Chart.js

The charts on the dashboard are rendered with Chart.js with the data being server rendered directly into the JavaScript rather than asynchronously. A service with functions for each chart handles building the arrays of data for the view to keep logic out of the view file. Above is an example of a stacked bar chart with different lead sources per day.